Computed Properties
Overview
Computed Properties are a specialized type of property that Mixpanel calculates dynamically at query time on the front end. Unlike standard event or profile properties, Mixpanel does not ingest Computed Properties with your raw data. Instead, it derives them in real time using the existing data in your dataset.
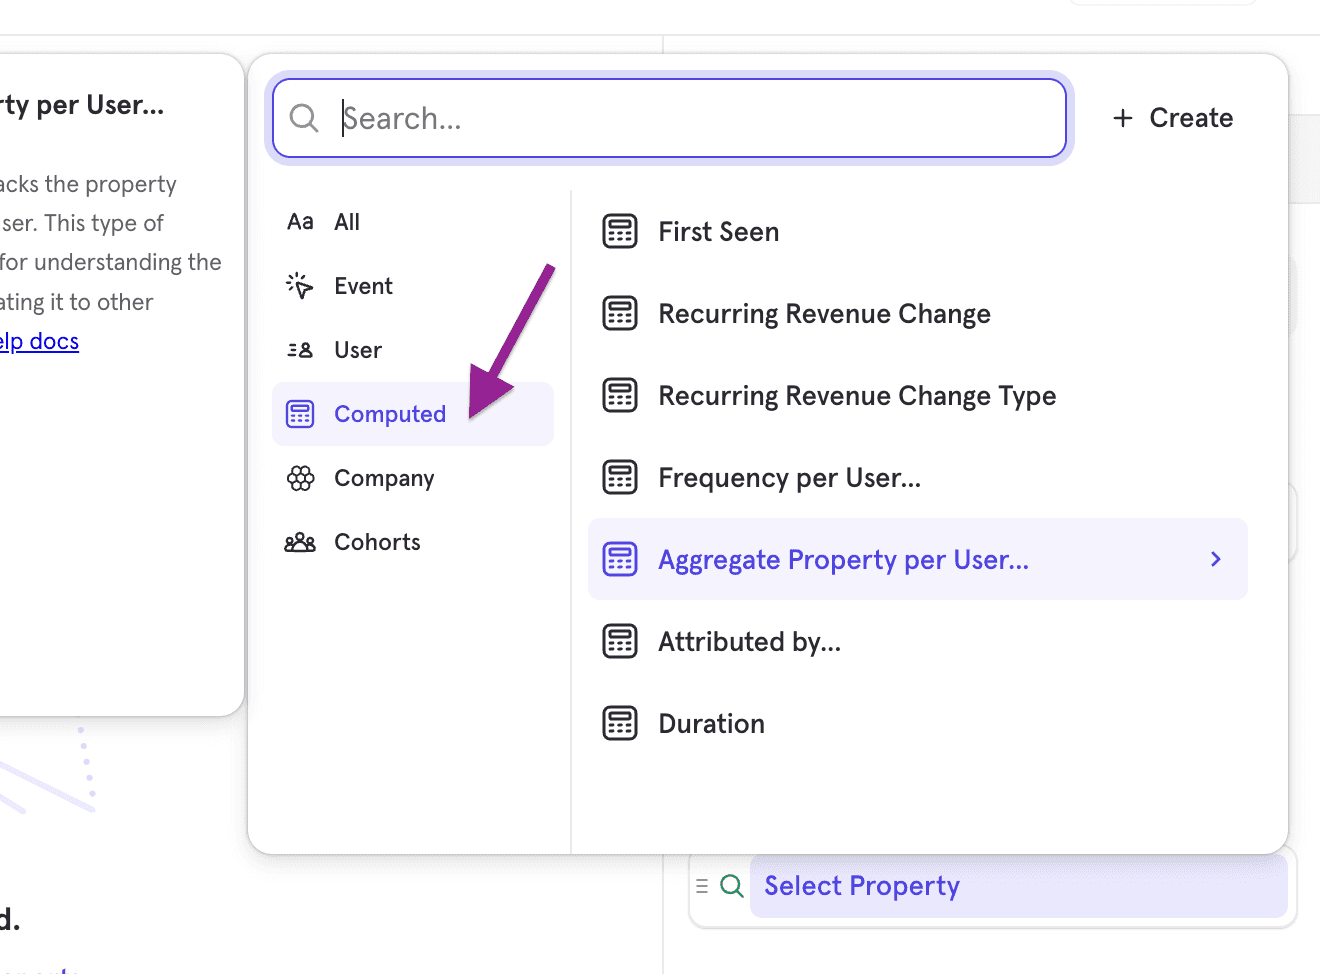
You can find Computed Properties labeled with the ‘Computed’ tag in the query builder.
Behavioral Properties
Behavioral properties allow you to use your user’s activity and use it as a property in your other analysis. A behavioral property is a virtual property, meaning it’s not a property that you are explicitly tracking, but a property that Mixpanel can compute and allow you to use in analysis.
Behavioral properties can be used anywhere, most typically in filters and breakdowns.
Frequency per User
After selecting this option, you must select an event to compute the frequency of. You can use this to segment your users by how many times they did an event, or use it to filter out users to only those who did an event a certain number of times.
Aggregate Property per User
After selecting this option, you must select an event, and then a property on that event. Finally, you can choose an aggregation type for this property. You can use this to segment your users by this property aggregation. For example, you may want to filter only for users who have greater than 100 minutes of video watch time, or you may want to segment users by their watch time.
Time Range
Per Interval
In insights, the time at which this computation is done is on a per-interval basis. For a line chart, that will be for each interval plotted on the chart. For bar, table, and pie, this interval is the entire date range selected in the date picker.
Between Steps
In funnels, the behavioral property is computed in the time range between 2 steps in your funnel. You can specify which steps in the funnel this applies to. In the case of doing “Frequency per User”, the event count does not include the events that make up the funnel itself, and only the events between the funnel steps.
After Step 1
In retention, the behavioral property is computed in the chosen time range after the entry event, up until the expiration window. For example, there may be a 7-day window in which we’re looking for an event. Even if the retaining action happens before the 7 days are up, we continue to count additional events.
Duration
The duration property returns the duration between 2 instances of an event. This works best for events that occur continuously during a session, such as Page View or Screen View. Users who did not track the same event again will appear in the “Did not convert” segment.
Attribution
Users on an Enterprise or Growth plan can access the Attribution feature. See our pricing page for more details.
Attribution helps teams attribute conversion credit to the touchpoints in a user journey, whether it’s to the first or last touch (single-touch attribution models) or to multiple touchpoints using a multi-touch attribution model like U-shape or Linear.
Consider the following example user journey:
- A user sees an ad for a product on Facebook
- The user clicks on the ad and is taken to the product page on the company’s website
- The user adds the product to their cart and begins the checkout process
- The user abandons the checkout process
- The user receives a retargeting ad for the product on Instagram
- The user clicks on the ad and completes the purchase
In this example, two touchpoints contribute to the successful conversion: the Facebook ad and the Instagram ad. Using an attribution model, we can assign different weights to these touchpoints to determine their relative importance in the conversion.
- Using a linear attribution model, we could assign a weight of 0.5 to each touchpoint, meaning that both the Facebook ad and the Instagram ad contributed equally to the conversion.
- Using a J-shaped attribution model, we could assign a weight of 0.75 to the Facebook ad and 0.25 to the Instagram ad.
- Using a Last Touch model, the complete conversion can be attributed to the Instagram ad.
- Using a First Touch model, the complete conversion can be attributed to the Facebook ad.
Usage
- Add your conversion metric.
- Attribution makes sense only when distributing the conversion metric across segments, so head to the breakdown section and choose the Mixpanel-computed property
Attributed by.... - In the second layer that opens up, choose the property you want to break down by (eg, UTM medium). You can also choose a custom property to break down here, for example, marketing channel, which generally is a combination of UTM medium, UTM source, and Referrer.
- Now that you have a working attribution model, Mixpanel will, by default, assign the metric the “Last Touch” model with a 30-day lookback window. To change the model, head to the metric section.
- If you want to include only certain channels or touchpoints in your attribution analysis, you can filter touchpoints from the breakdown overflow menu. A use-case for this is excluding organic touchpoints from attribution analysis.
👉🏽 NOTE: If you are running attribution predominantly on UTM_medium, UTM_source, or UTM_campaign, make sure you’re tracking UTM parameters as event properties on every user touchpoint.
If you use a Mixpanel JS SDK, we have updated our SDK to track UTM parameters more effectively to support multi-touch attribution models.
Attribution Models
- First Touch: Gives 100% credit to the first touchpoint within the attribution lookback window
- Last Touch: Gives 100% credit to the last touchpoint within the attribution lookback window
- Linear: Gives equal credit to every touchpoint seen leading up to a conversion within the attribution lookback window
- Participation: Gives 100% credit to every unique touchpoint seen within the attribution window. The total number of conversions is inflated compared to other attribution models. For example, with 5 property values, each would receive 100% credit, showing 5 conversions.
- Time-Decay: The weight of each channel depends on the amount of time that passed between the touch point initiation and the eventual conversion. This model follows an exponential decay with a 7-day half-life parameter.
- U-shaped: Gives 40% credit to the first touchpoint, 40% credit to the last touchpoint, and divides the remaining 20% to any touchpoints in between. With 2 touchpoints, the credit is normalized (50%, 50%). With 6 touchpoints, the middle 4 touchpoints would share the 20% (40%, 5%, 5%, 5%, 5%, 40%).
- J-shaped: Gives 20% credit to the first touchpoint, 60% credit to the last touchpoint, and divides the remaining 20% to any touchpoints in between. With 2 touchpoints, the credit is normalized (25%, 75%). With 6 touchpoints, the middle 4 touchpoints would share the 20% (20%, 5%, 5%, 5%, 5%, 60%).
- Inverse J-shaped: Gives 60% credit to the first touchpoint, 20% credit to the last touchpoint, and divides the remaining 20% to any touchpoints in between. With 2 touchpoints, the credit is normalized (75%, 25%). With 6 touchpoints, the middle 4 touchpoints would share the 20% (60%, 5%, 5%, 5%, 5%, 20%).
- Custom: Customize the weight to be given to the first and last touchpoint, and all other touchpoints in between, based on your use-case.
Glossary
- User journey: Consists of touchpoints and the conversion event. It is possible for a conversion event to have no corresponding touchpoints (e.g., UTM parameters). In this case, we consider it a ‘direct’ conversion.
- Conversion: The primary event you are interested in analyzing with multi-touch attribution models. Typically, some final value-generating interaction, such as “Signup”, “Upgrade”, or “Payment”.
- Touchpoint: These are actions (events) a user has taken or been exposed to along the journey before doing the conversion event. For example, a user does event A → B → C → D (conversion event) in a 7-day period. For a lookback window of 7 days, A, B, and C are all considered touchpoints.
- Attributed by property: This is the property on a touchpoint event that we use for the attribution model. The canonical example is utm_source.
- Lookback window: The time window where a user’s events with this attribution property are counted towards the calculation. The window ends when the conversion metric happens.
Attribution FAQ
1. How does Mixpanel compute attribution under the hood?
Please watch this video to better understand how this is computed.
2. What does attribution on “unique users” mean?
We need one single conversion event that we can use to “qualify” a user.
For example: between May 1 and May 15, Jack made 3 purchases.
- May 1: Purchase 1: Computer [came from Instagram]
- May 7: Purchase 2: Laptop [came from Instagram]
- May 10: Purchase 3: TV [came from Facebook]
Now note that, while 3 purchases have been made, only one unique user has been converted.
How will attribution work with unique users? There will be 2 options depending on the use-case:
- Option 1: When running attribution on Jack, we want to consider Jack on May 10, his last qualifying conversion, run a lookback window starting at this point, and consider all attribution before it influenced the 3 purchases.
- Last Touch for Jack would be: Facebook -> When would this option be useful? In e-commerce companies, when looking at the cost of acquiring a user, you want to consider all the purchases until their last one.
- Option 2: Consider Jack on May 1, his first qualifying conversion, and run a lookback before it.
- Last Touch for Jack would be: Instagram -> When would this option be useful? For acquisition teams, when looking at getting a user to the experience for the first time, you want to consider their first qualifying event.
Some nuances to note
- In a time-series chart, the first and last qualifying conversion is within the chart interval. For example, if you have a 6M chart with a monthly interval, you’re looking at first and last conversion within a month, not 6M.

- In non-time series charts, the chart interval and the qualifying conversion interval are the same. If your chart is for 6M, the first and last conversion is also seen within the 6M period.

3. What does filtering do in attribution?
Once attribution is computed, filtering narrows total conversion events to only include/exclude those with the associated attribution property.
Here’s a real-life scenario to better illustrate how this works:
- Purchase 1:
- Jan 15th: Made purchase (visited via LinkedIn ad)
- Jan 10th: visited via Google
- Attribution data:
- Last Touch: LinkedIn
- All Sources: LinkedIn, Google
- Attribution data:
- Purchase 2:
- Jan 18th: Made Purchase (came directly)
- Jan 12th: visited via Facebook (Last Touch: Direct; All Sources: Direct, Facebook)
- Attribution data:
- Last Touch: Direct
- All Sources: Direct, Facebook
- Attribution data:
- Purchase 3:
- Jan 20th: Made Purchase (came via Google)
- Attribution data:
- Last Touch: Google
- All Sources: Google
- Attribution data:
- Jan 20th: Made Purchase (came via Google)
On Jan 30th, doing some attribution analysis, here’s how you could answer a few of the common questions asked:
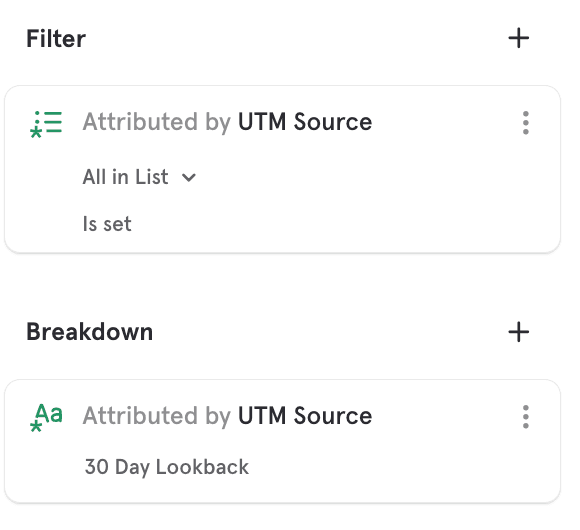
- I want to look at purchases that only came from a non-direct channel.
- Answer: 2 - Purchases 1 and 3
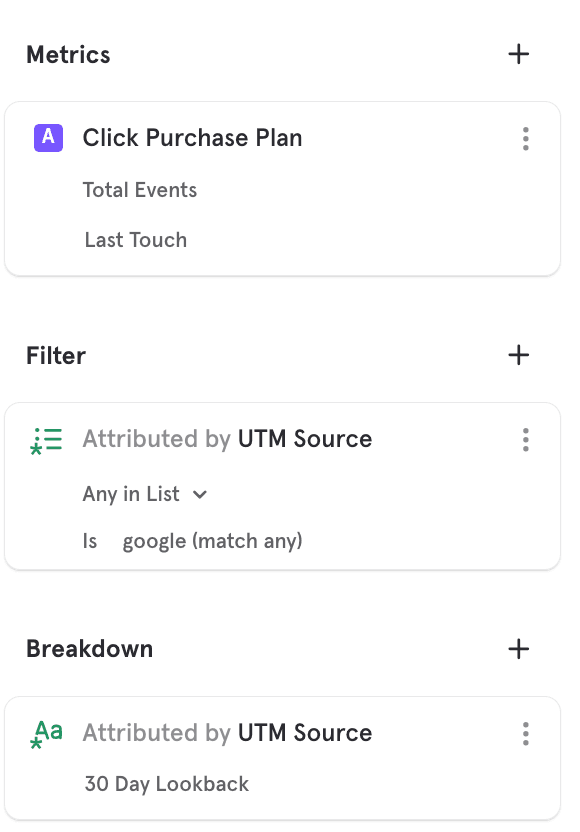
- I want to look at how many last-touch purchases came via Google.
- Answer: 1 - Purchase 3
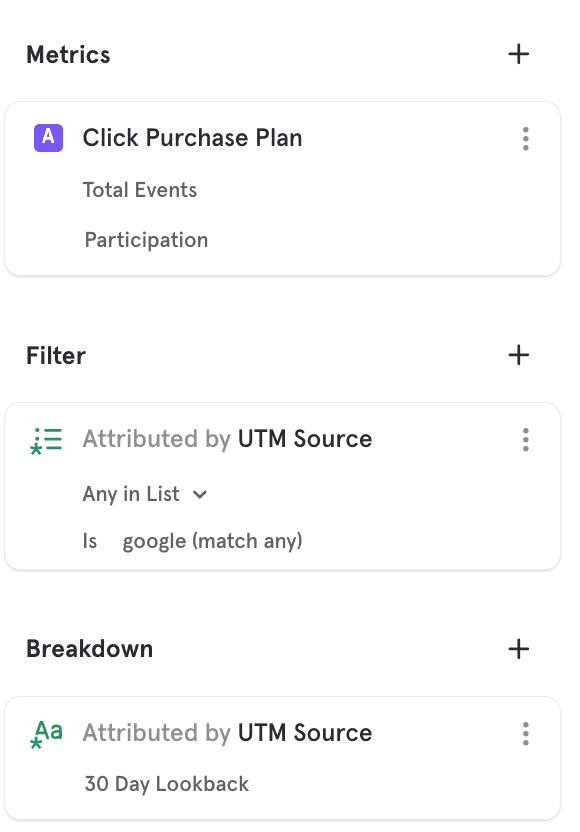
- I want to look at how many purchases came via Google (can be any touch in the last 30 days).
- Answer: 2 - Purchases 1 and 3
You can apply a filter on an attribution property only after an attribution breakdown has been applied. Here’s how:
1: Turn on Attribution analysis by going to the breakdown section and choosing Attributed by.. and property XYZ.
2a: Once the attribution model has been applied, go to the Filters section and choose the Attributed by XXX computed property - you can apply an attribution filter only on the property used in the attribution breakdown.
2b: Once the attribution model has been applied, click on the chart bar and filter/exclude the segments as needed.
4. What does the “(not set)” attribution segment mean?
You may see a “(not set)” segment in your report when using the Attribution feature. This occurs when the attribution property is missing from all events being evaluated for the user.
Funnels-specific Computed Properties
The Funnel report supports two unique computed properties. The Time to Convert property returns the time in seconds needed to convert between funnel steps, and the Property Sum property allows you to sum up a numeric property as a user moves through funnel steps.
Was this page useful?